
“The power of data visualization is that, it can generate clear and actionable insight from datasets, even complex in nature.”
Introduction
Geospatial technology refers to all the technologies used to collect, store, visualize, and analyze data that is referenced to a location. In geospatial technology, data visualization plays a more prominent role than any other technology. The power of data visualization is that it can generate clear and actionable insight from datasets even complex in nature, which is not possible with traditional descriptive statistics. By keeping this in mind, Uber’s data visualization team developed a Web based Geospatial data visualization platform, named Kepler.gl.
If you are new to geospatial technology or just curious about this wonderful subject or even if you are a pro in this domain, Kepler.gl is a promising platform for you. Thanks to its unique, user-friendly design and rich data visualization tools, the developers behind this platform have given us an opportunity to explore and dive deep into our geospatial data within a web interface.
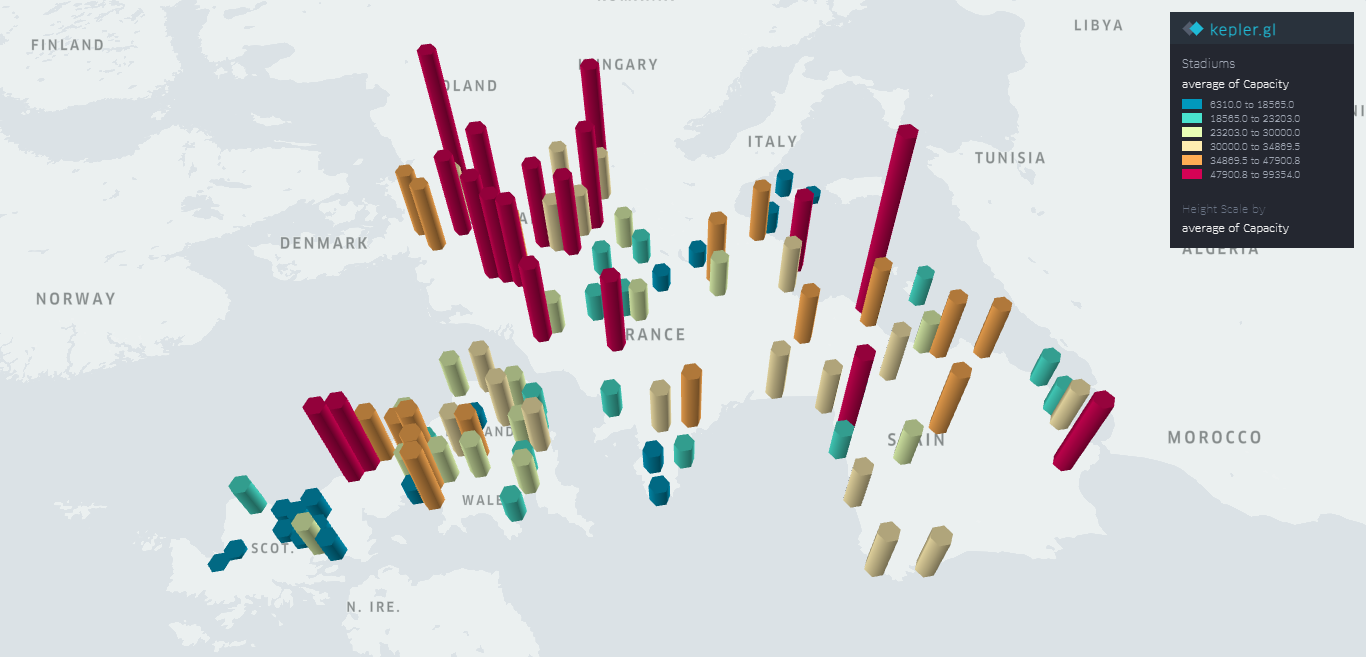
Map of capacity of football stadiums prepared using Kepler.gl
Notable Features of Kepler.gl
Kepler.gl is a powerful open source Geospatial Data Visualization platform. You can visualize Geospatial datasets even with larger size in your favorite Web Browser without much difficulty. All the processing required for data exploration is performed locally using the client’s graphics hardware. Kepler.gl can visualize your data in 2D, 3D, and 4D formats.
Another notable feature of Kepler.gl is its base map options. Kepler.gl offers its users a number of default Base maps with additional customization options. As an unavoidable feature of any modern Geospatial data processing platform, Kepler.gl provide options for visualizing time series data and generating time playback video. For advanced level users, Kepler.gl offers direct integration into a React-based web application or Jupyter notebook, which will give additional control over data and visualization.
Let’s Get Started
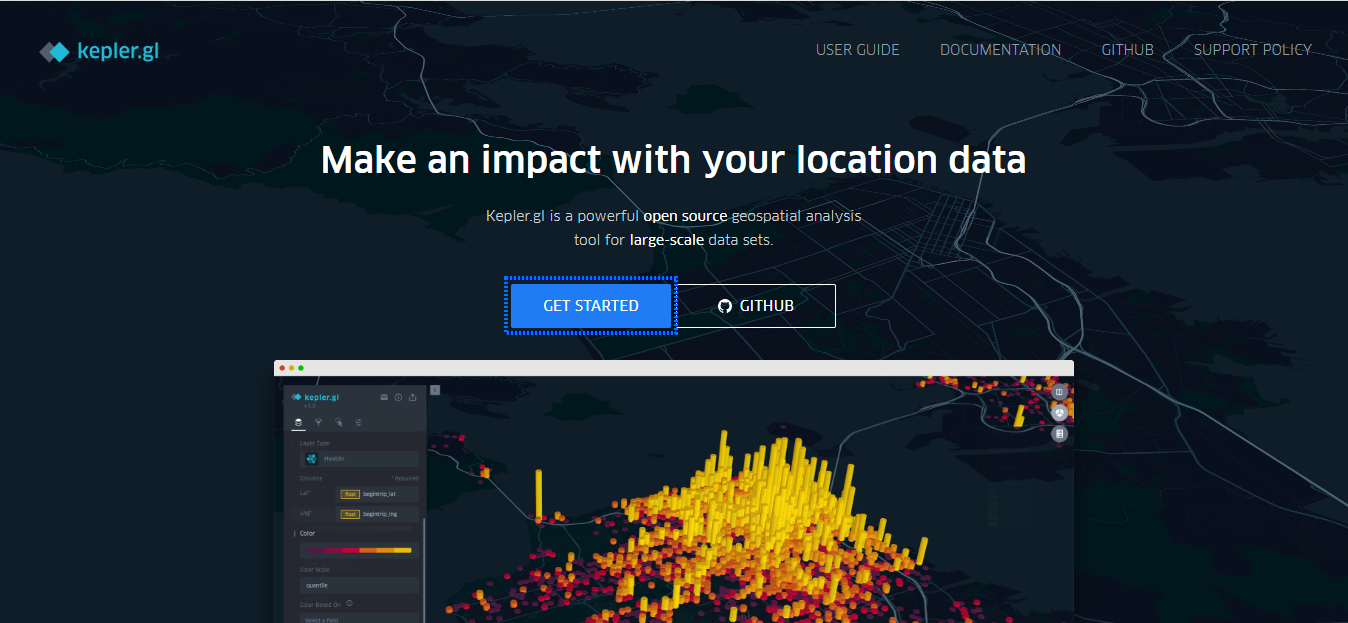
1. Open https://kepler.gl/. Click on “GET STARTED”.
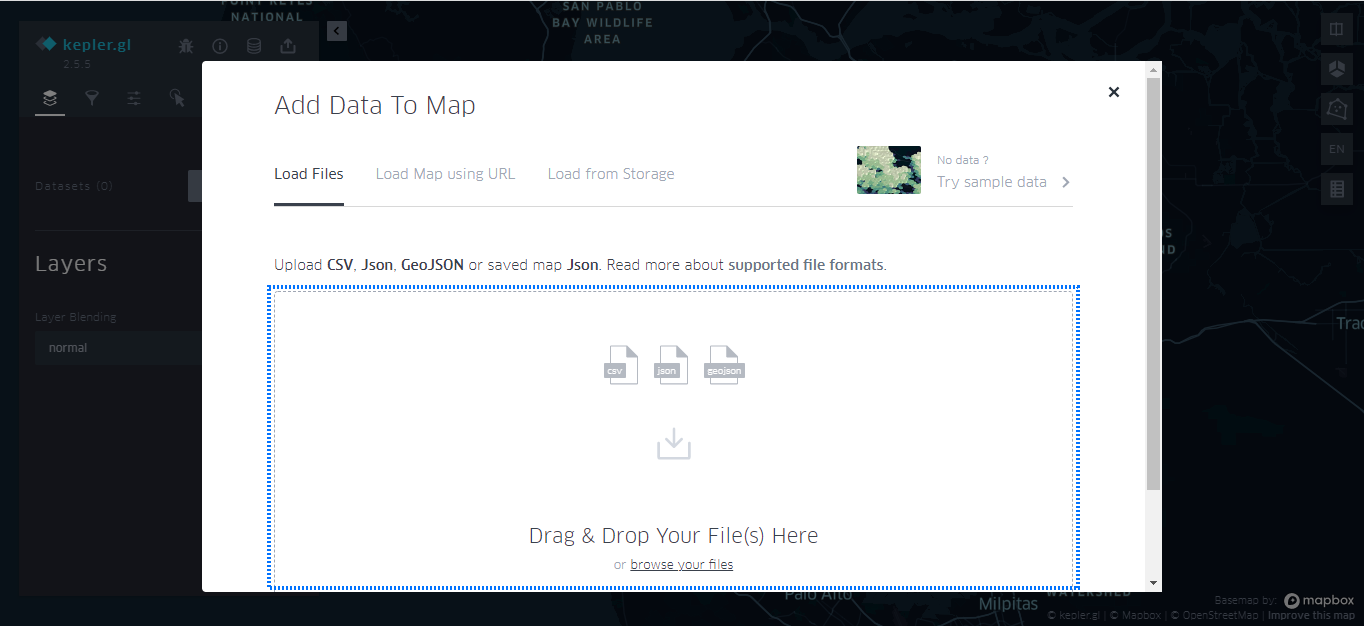
2. Kepler will accept data in CSV, GeoJSON, JSON formats. Either you can use sample data provided by Kepler or download the data of “Airport locations” that we used for this exercise from this link. In the later case, download and unzip the data, drag and drop or browse and upload your data to Kepler.
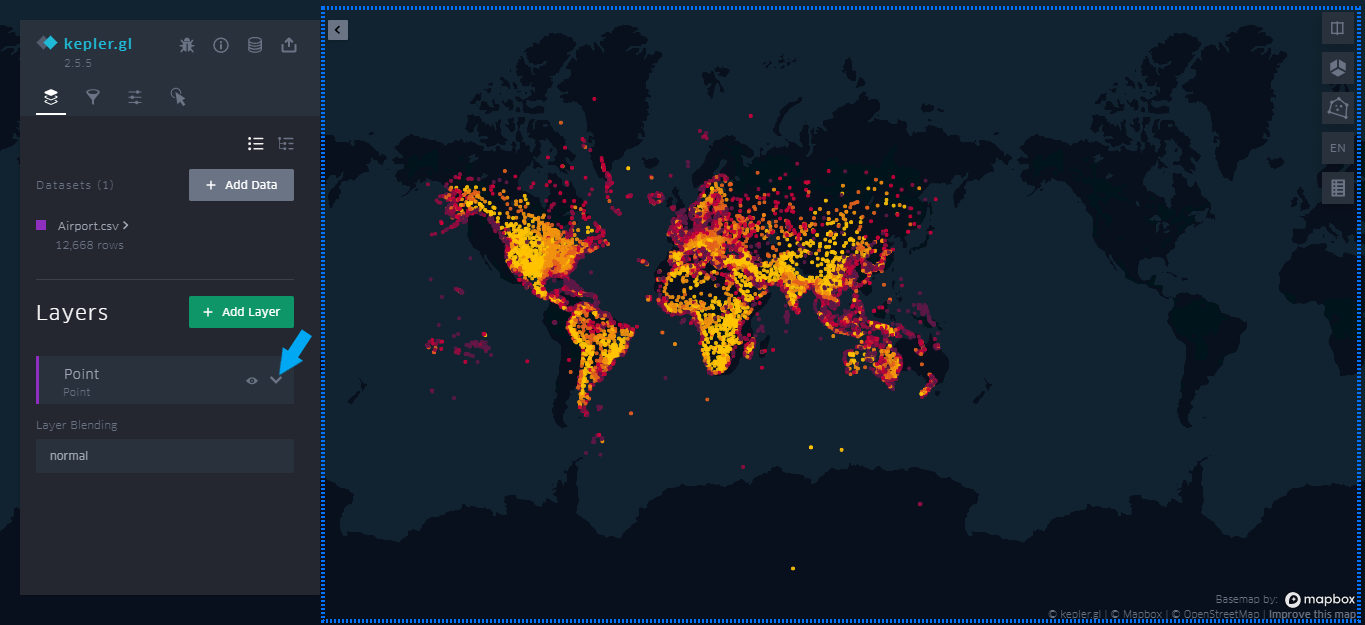
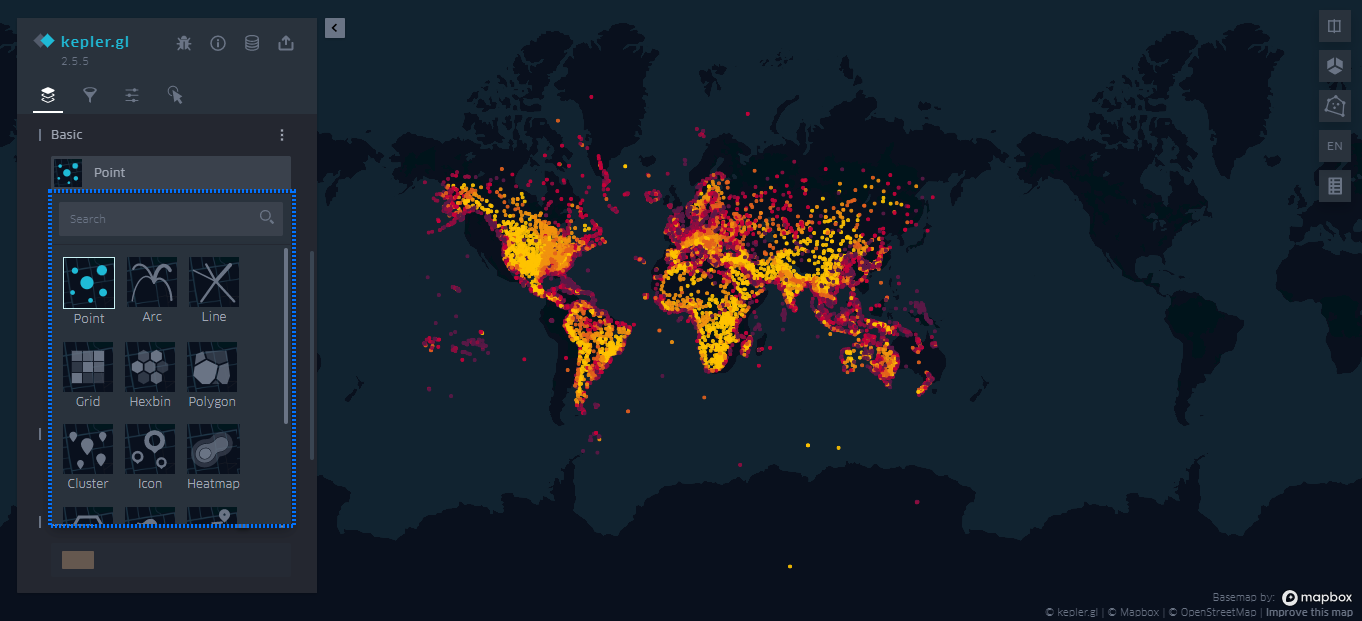
3. If your CSV file stores XY values with column names like ‘Latitude’ and ‘Longitude,’ Kepler will automatically identify them and plot the points with a default symbology, as shown below. Now, you can hover your mouse pointer over any point in the map to see the attributes of that point. Click on the dropdown near the “Point” tab below the “Layers” to customize your symbology.
4. In Kepler, symbols are represented as layers such as Point layer, Arc Layer, Line Layer. To use Arc Layer and Line Layer, you need “Source” and “Target” Latitude, Longitude columns in your data. Likewise, to use some Layers, your data need to satisfy additional requirements such as Hex ID, Token columns.
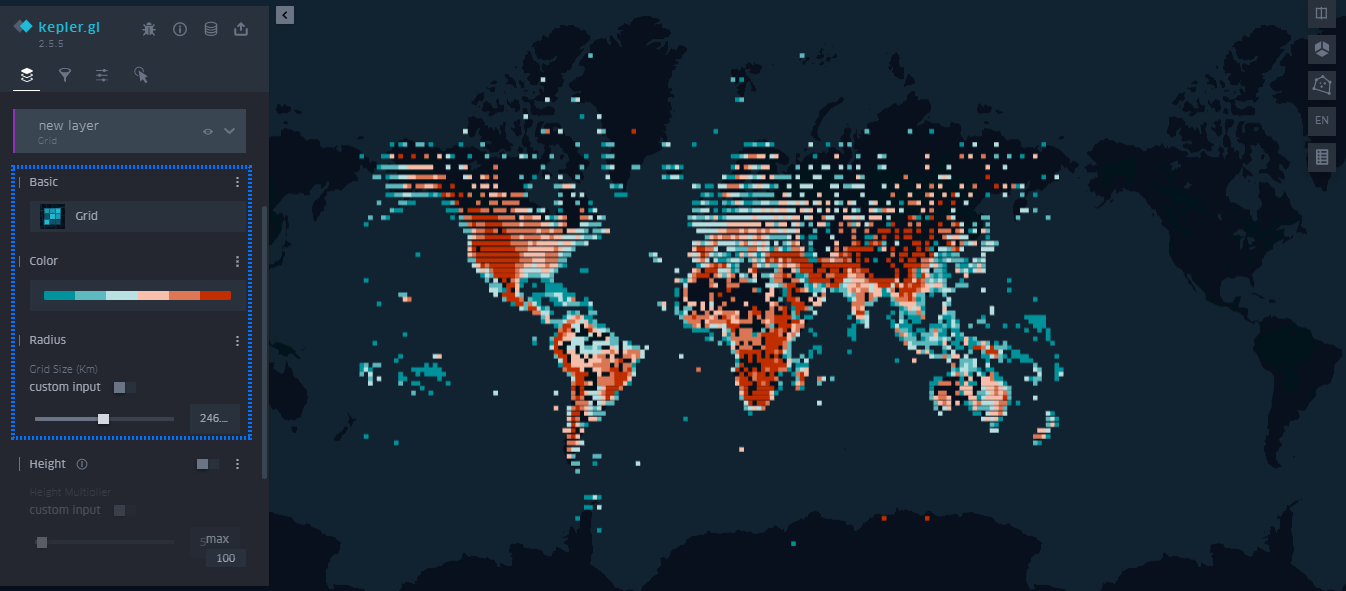
5. Here, I changed the Point Layer to Grid Layer, modified the color palette, and increased the radius of the layer, as shown below.
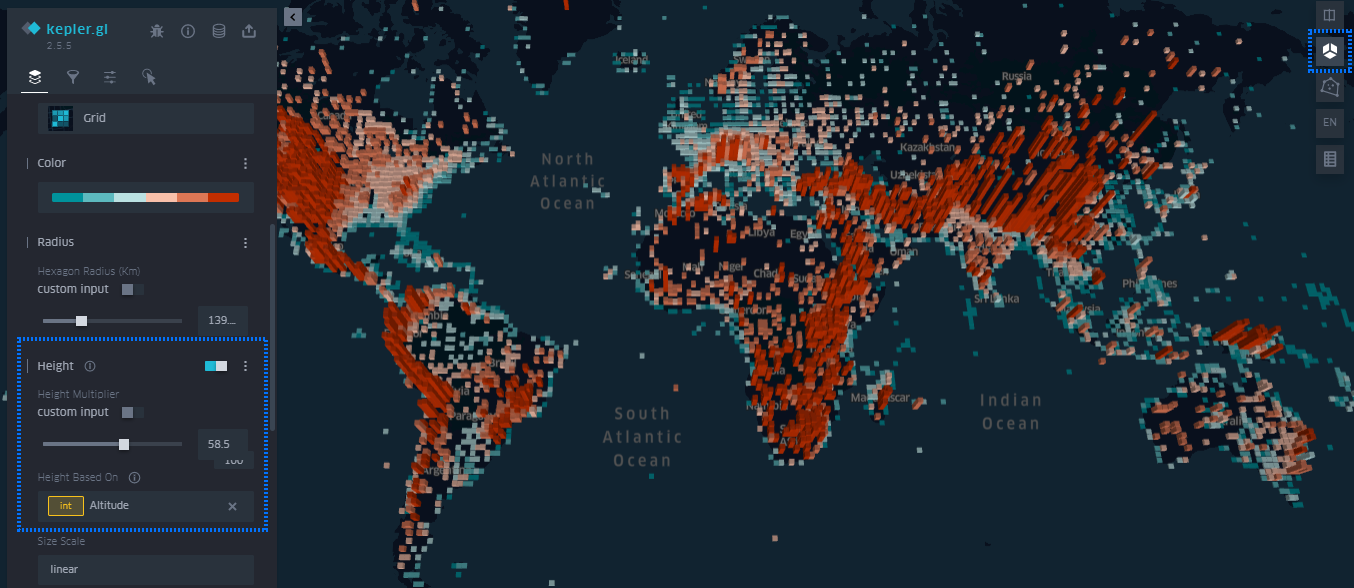
6. Want to display your data in 3D? First, click on the second icon on the top Right of the Screen. Then turn on the button near the “Height” text on the left side panel. You can adjust the height multiplier by moving the slider below the “Custom input” option to change the elevation scale of the data.
Accept the default option to represent the height, or choose a field of your choice by clicking on the three vertical dots near the “Height” toggle button and select a field from “Height Based On” option. You can use your right mouse button to rotate the 3D map. Below map shows the location of airports in the world with altitude as 3rd dimension.
7. Voilà, here is your first 3D map created with Kepler. Want to save the visualization? Click on the top right icon on the left side panel as shown in the image.
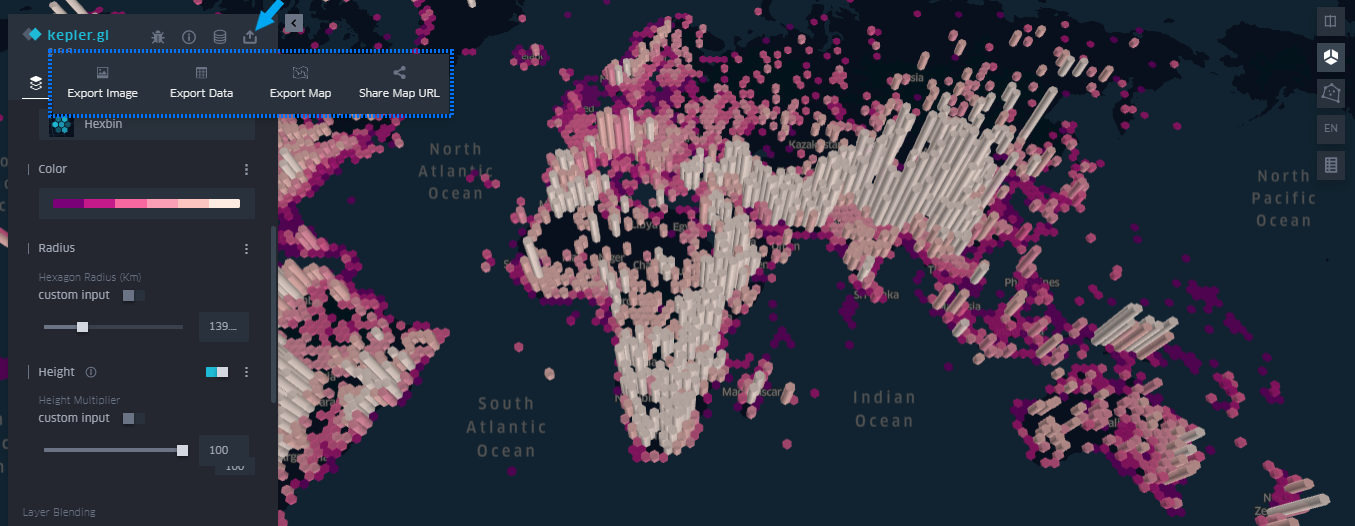
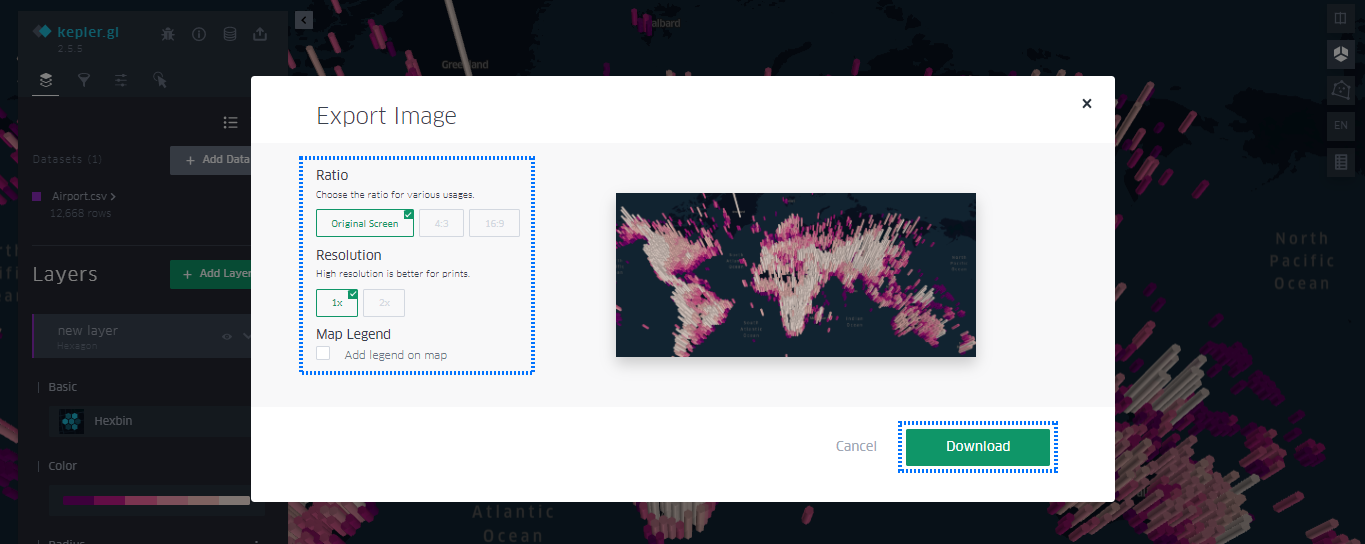
8. Kepler.gl offers multiple ways to export your map. You can save it as an image in different resolutions, or export your data as a CSV file. You can also save it in HTML or JSON format, which can be visualized in Kepler later or used in other applications. Furthermore, you can share the map URL through cloud storage options like Dropbox or Carto.
Here is an example of exporting your data as an image. While exporting as image, you can set the Ratio and Resolution of image. Also, you can add a legend to the map by turn on the Checkbox near the “Add legend on map” text.
Conclusion
In this step-by-step guide, you would have got a brief understanding on different tools and options available in Kepler.gl for exploring your Geospatial data. You can experiment with different Layers and filtering options to identify which combinations will fit best with your specific needs.
Data Source
https://openflights.org